Using filters in DAX

In this post, I will show some samples on different ways to use filtering in DAX. If you write ineffective filters you will most likely always run into performance issues. We will also see the difference between using SUMMARIZE() and ROW() in queries that only return one row.

Let’s pretend one of your customers wants to know the sum of sales for the product “AWC Logo Cap”. And the minimum sales.

The benchmarking is done by running the different queries in DAX Studio multiple times. I have cleared the cache between the executions.

Sample query 1.

DEFINE
    MEASURE 'FactInternetSales'[MyFilteredNumber] =
        CALCULATE (
            SUM ( FactInternetSales[UnitPrice] ),
            FILTER ( DimProduct, [EnglishProductName] = "AWC Logo Cap" )
        )
    MEASURE 'FactInternetSales'[MyFilteredNumberMin] =
        CALCULATE (
            MIN ( FactInternetSales[UnitPrice] ),
            FILTER ( DimProduct, [EnglishProductName] = "AWC Logo Cap" )
        )
EVALUATE
 (
    FILTER (
        SUMMARIZE (
            FactInternetSales,
            DimProduct[EnglishProductName],
            "Filtered result", 'FactInternetSales'[MyFilteredNumber],
            "Filtered result min", 'FactInternetSales'[MyFilteredNumberMin]
        ),
        'FactInternetSales'[MyFilteredNumber] > 0
    )
)

This query produces the correct answer. But is does not perform very well.

It took 32 MS.

Continue reading

Useful filters for your time dimension (DAX / Tabular)

It is always nice to have some time filters in your Tabular model. Because of reuse I try to create most of these filters in the data source. But if that is not an option you can off course add them directly to your Tabular model. So here are some useful samples.

The first one will give you a flag on the last date with sales.

First lets create a new measure.

Last Sales Date:=LASTNONBLANK('Date'[Date]; CALCULATE(SUM('Internet Sales'[Sales Amount])))

And then add a new column in the date dimension. I my sample I will call this column “Last Date With Sales”

=IF('Date'[Date] = calculate('Date'[Last Sales Date];ALL('Date'));1;0)

So if you need the last date with sales in your report you can add the dimension attribute “Last Date With Sales” and then filter the value to 1. This is quite handy if you are using date functions such as TotalYTD or TotalMTD. Please note that you can use the FIRSTNONBLANK functions to. This will return the first date with sales.

The next flag will be a flag that indicates tomorrows date.

To make this flag I will create a new column and add the following expression

=IF('Date'[Date] = TODAY()-1;1;0)

To test this in AdventureWork you first have to figure out how many days to subtract. This can be done by using the following SQL

select datediff(day, '2010/01/02', getdate())

And then change your expression to something like this

=IF('Date'[Date] = TODAY()-1983;1;0)

To get the current month you can add a column like this

=IF(Month('Date'[Date]) = MONTH(TODAY()-1) && YEAR('Date'[Date]) = YEAR(TODAY()-1);1;0)

And to get the current year you can add a column like this

=IF(YEAR('Date'[Date]) = YEAR(TODAY()-1);1;0)

Use you inactive relations with “USERELATIONSHIP” in DAX

In Tabular models you can only have one active relationship between two tables. But you can have multiple inactive ones. In the image below you can see how the active relations are marked with a solid line. And then inactive ones are marked as dotted lines.

Relationsships

So how do you use your inactive ones?

I start with a basic query that gives me the sales per year. Because I did not specify a relationsship the active relationship is used. In this case the order date.

EVALUATE
 (
    ADDCOLUMNS (
        VALUES ( 'Date'[Calendar Year] ),
        "Total sales", 'Internet Sales'[Internet Total Sales]
    )
)

And the result

Relation 1

So if I want to use an inactive relationship too I need to use the USERELATIONSHIP function. Below is an example on how to get both sales per order year and sales per shipment year in the same query.

DEFINE
    MEASURE 'Internet Sales'[Total Sales By ShipmentDate] =
        CALCULATE (
            'Internet Sales'[Internet Total Sales],
            USERELATIONSHIP ( 'Internet Sales'[ShipDateKey], 'Date'[DateKey] )
        )
EVALUATE
 (
    ADDCOLUMNS (
        VALUES ( 'Date'[Calendar Year] ),
        "Total sales", 'Internet Sales'[Internet Total Sales],
        "Total sales by ShipmentDate", 'Internet Sales'[Total Sales By ShipmentDate]
    )
)

And the result will look like this

Relation 2

Search for dimension members in DAX using the “search” function

If you want to search for specific dimension members you can use the “Search” function in DAX. The “Search” function also support wildcards.

So if you want sales for every products that contains the word “Mountain” you can write a query like this.

EVALUATE
FILTER (
    CALCULATETABLE (
        ADDCOLUMNS (
            VALUES ( 'Product'[Product Name] ),
            "Sum of Sales Amount", 'Internet Sales'[Internet Total Sales]
        )
    ),
    'Internet Sales'[Internet Total Sales] <> 0
        && SEARCH ( "*Mountain*", 'Product'[Product Name], 1, 0 ) <> 0
)

And the result will look like this

Search 1

Below is a more complex sample. It returns all products that contains the word “Mountain”. But it also returns the percentage of the total for all products containing the word “mountain”

DEFINE
    MEASURE 'Internet Sales'[Total] =
        CALCULATE (
            'Internet Sales'[Internet Total Sales],
            FILTER (
                ALL ( 'Product'[Product Name] ),
                SEARCH ( "*Mountain*", 'Product'[Product Name], 1, 0 ) <> 0
            )
        )
EVALUATE
FILTER (
    CALCULATETABLE (
        ADDCOLUMNS (
            VALUES ( 'Product'[Product Name] ),
            "Sum of Sales Amount", 'Internet Sales'[Internet Total Sales],
            "Percent of all mountain", FORMAT (
                DIVIDE (
                    'Internet Sales'[Internet Total Sales],
                    'Internet Sales'[Total]
                ),
                "Percent"
            )
        )
    ),
    'Internet Sales'[Internet Total Sales] <> 0
        && SEARCH ( "*Mountain*", 'Product'[Product Name], 1, 0 ) <> 0
)

And the results look like this

Search 2

Count your top selling products with DAX

One of my customers wanted to count their top selling products. Since sharing is caring I will show you how this can be achived in this post 🙂

I want to list all products that sold for at least 5000 dollars in the year 2005.

DEFINE
    MEASURE 'Internet Sales'[Sales] =
        SUM ( 'Internet Sales'[Sales Amount] )
EVALUATE
        ADDCOLUMNS (
            FILTER (
                SUMMARIZE (
                    CROSSJOIN (
                        VALUES ( 'Date'[Calendar Year] ),
                        VALUES ( 'Product'[Product Id] )
                    ),
                    'Date'[Calendar Year],
                    'Product'[Product Id]
                ),
                'Internet Sales'[Sales] >= 5000
                    && 'Date'[Calendar Year] = 2005
            ),
            "Sum of Sales", 'Internet Sales'[Sales]
) ORDER BY 'Internet Sales'[Sales] DESC

And the result will look like this

Top selling 1

If you want to only display the number of products you can add “row” and “countrows” like this

DEFINE
    MEASURE 'Internet Sales'[Sales] =
        SUM ( 'Internet Sales'[Sales Amount] )
EVALUATE
ROW (
    "Count", COUNTROWS (
        ADDCOLUMNS (
            FILTER (
                SUMMARIZE (
                    CROSSJOIN (
                        VALUES ( 'Date'[Calendar Year] ),
                        VALUES ( 'Product'[Product Id] )
                    ),
                    'Date'[Calendar Year],
                    'Product'[Product Id]
                ),
                'Internet Sales'[Sales] >= 5000
                    && 'Date'[Calendar Year] = 2005
            ),
            "Sum of Sales", 'Internet Sales'[Sales]
        )
    )
)

And the result will look like this

Top selling 2

Testing row level security in Tabular (DAX)

In this post I will demonstrate how to add row level security in your tabular model. This can be a useful feature if you want to restrict access to different dimension members for different users.

First of all we need to create a new windows user on your PC / server. Lets call this user “TestUser2”

Then I will create a new table with user names and which customers they should be able of viewing.


use [AdventureWorksDW2012]

create table [UserAccess] 
(
	FullDomainUserName varchar(200),
	DomainUser varchar (100),
	CustomerKey int
)

insert into [UserAccess] values ('yourdomain\TestUser2', 'TestUser2', 11511)
insert into [UserAccess] values ('yourdomain\TestUser2', 'TestUser2', 11512)

Open the Tabular model project in Visual Studio Data Tools.

Lets add this table to the model and then create a relationship to Customer and column CustomerKey. Click “Hide from client tools” on the UserAccess table.

After you have done this your model will look like this

Screenshot useraccess

Add a new role (Model -> Roles) called TestRole. Give this read permissions.

Then add this DAX to the DAX filter on the Customer table

='Customer'[CustomerKey]=LOOKUPVALUE('UserAccess'[CustomerKey], 'UserAccess'[FullDomainUserName], USERNAME(), 'UserAccess'[CustomerKey], 'Customer'[CustomerKey]) 

Role 1

Add your new Windows users to members

Role 2

Deploy your model.

Open a Excel pivot. When Connection to the SSAS server impersonate the TestUser2 user. After doing that your pivot will look like this.

Role pivot

Creating a KPI in Tabular (DAX)

In this post I will explain how to make a simple KPI in SSAS Tabular. First step is to make two calculated measure in our model. The first one will give us the sales for 01.10.2006. This will be our base measure.

KPI_SalesYesterDay:=Calculate(SUM([Sales Amount]);Filter(Date;'Date'[Date] = DATE ( 2006; 10; 01)))

The second measure defines the target value. That might look like this.

KPI_SalesComparableDay:=Calculate(SUM([Sales Amount]);Filter(Date;'Date'[Date] = DATE ( 2005; 11; 01)))

After creating these two measures you right-click on the measure “KPI_SalesYesterDay” and click “Create KPI”.

This screen will appear

KPI 1

Use the default values. Then deploy the model to the server.

If you create a new Excel pivot it will appear like this:

KPI 2

In a more real life example you might want to use dynamic dates. Like this

KPI_SalesYesterDay:=Calculate(SUM([Sales Amount]);Filter('Date';FORMAT('Date'[Date]; "yyyy-MM-dd") = FORMAT(NOW() - 1; "yyyy-MM-dd")))

This will give us the sales for yesterday. And then subtract 365 days on the target measure to get the comparable day.

KPI_SalesComparableDay:=Calculate(SUM([Sales Amount]);Filter('Date';FORMAT('Date'[Date]; "yyyy-MM-dd") = 
FORMAT(NOW() - 365; "yyyy-MM-dd")))

Or just leave the date filtering to whatever the user chooses

Percent of total in a hierarchy (DAX)

Getting percent of total in a hierarchy is easy in DAX. In this example we will use the Geography hierarchy.

Geography 1

Then I will create 2 calculated measures in my model.

TotalSales2:=calculate(SUM([Order Quantity]);ALL('Geography'))

And

Ratio To Total:=Sum([Order Quantity]) / [TotalSales2]

The last one should be formatted as percent.

Then process and deploy your model.

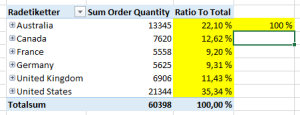
If you open an Excel pivot you should see something like this

Hierarchy Excel 2

If you summarize “Ratio To Total” in this pivot you will get 100 %.

When changing the pivot to show city instead of country the percent still works as intended.

Hierarchy Excel 3

I did not show all the cities in the screenshot above

Percent of parent in hierarchy (DAX)

Getting percent of parent in a dimension without a hierarchy is quite simple. But to get percent of parent in a hierarchy with several levels you will have to add some more code. In the current version of DAX you will have to write code for each level.

My sample query will only work for the hierarchy in the “Geography” dimension called “Geography”.

Geography 1

Then I will add 2 calculated measures to my model.

ParentSalesEmployee :=
IF (
    ISFILTERED ( 'Geography'[City] );
    CALCULATE (
        SUM ( [Order Quantity] );
        ALL ( 'Geography'[City] )
    );
    IF (
        ISFILTERED ( 'Geography'[State Province Name] );
        CALCULATE (
            SUM ( [Order Quantity] );
            ALL ( 'Geography'[State Province Name] )
        );
        CALCULATE (
            SUM ( [Order Quantity] );
            ALL ( 'Geography'[Country Region Name] )
        )
    )
)

And then

Ratio To Parent:=Sum([Order Quantity]) / [ParentSalesEmployee]

And the result will looks like this:

Geography 2

I hope hierachy handling will become better in next version of DAX…

Get percent of total in DAX using ALLSELECTED()

To get percent of total in DAX we can use the ALLSELECTED function. To demonstrate how this can be achieved I will make 3 calculated measures in my model.

1. TotalSales:=CALCULATE(SUM([Order Quantity]);ALLSELECTED())
2. Sum Order Quantity:=Sum([Order Quantity])
3. Percent Of Total:=[Sum Order Quantity] / [TotalSales]

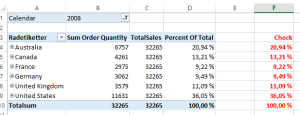
The first measure will give the total quantity. The second one will give sum quantity for each dimension member. The last one will give the percent. To make the last one nice and readable you can format it as percent.

This is how it will look in an Excel pivot

Percent of total

This easy approach will only work on the first level in a hierarchy. To make it work on multiple levels you have to extend the code. But that will be an other post 🙂